Performance Prediction Modelling:
Cannington Underground
JKTech was engaged to develop processing performance prediction models to improve medium and long-term planning, and forecasting for South32's Cannington underground mine in North-west Queensland, Australia.
During a previous project JKTech had identified that the operation's ore types needed to be revised as the actual production was not matching in-house methodologies forecasts.
Cannington Underground Mine Snapshot

Mining method:
Underground, longhole open stoping

Commodities:
Silver, lead and zinc

Production:
2,792 thousand wet metric
tonnes of ore
The Challenge
The increasing complexity and variability of mineralisation of Cannington ores were negatively impacting processing rates, metal recovery and concentrate quality. Cannington were seeking assistance to develop a geo-metallurgical programs to improve the accuracy of production forecasting.
The JKTech Solution
JKTech aimed to develop accurate performance prediction models for mill throughput, recovery and concentrate grades, and penalty elements by combining expertise in Mine-to-Mill and geometallurgical methodologies.
Stage 1 - Sample selection analysis and conducting test work
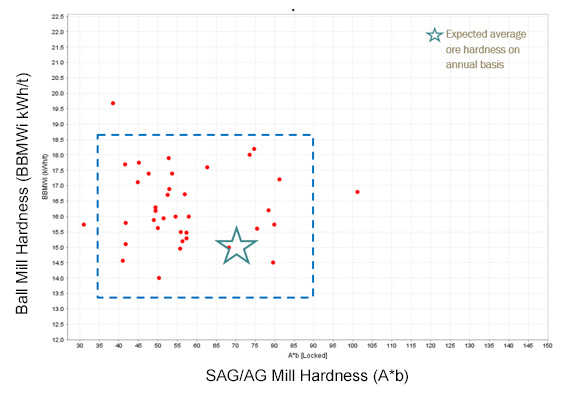
Existing test work indicated a large variability in mill hardness within existing ore. For many of the current ore types the mill hardness tests were harder from both a SAG/AG mill perspective (Axb) and Ball mill perspective (BBMWI) than was assumed for planning. This was supported by operational data for Axb.
The lack of confidence in hardness prediction and variability, along with the feed size, resulted in unexpected throughput performance - usually lower than expected.
Given the available inputs and knowledge, the JKTech team selected a methodology that involved:
- Revision of the entire operation’s resource/reserve geological coding;
- Integration with the site geotechnical database;
- 1st stage of calibration using JKTech’s global mill hardness database; and
- 2nd stage of calibration using the operations mill hardness database.
The models for each hardness type were based on assays and developed for Axb and BBMWI and captured the variability in Axb and BBMWI across the deposit with a high degree of confidence.
The throughput model catered for variable hardness and a range of primary grind size targets to allow flexibility in planning/production forecasting.
Stage 2 - Performance model development
Analysis of existing flotation test work showed a wide range of responses in rougher flotation for each ore type. Multi-element analysis of the samples as logged showed significant variability for almost every ore type.
Alternate classification schemes capable of providing better consistency in the classification of separation performance were developed and applied to the life-of-mine drilling.
The result was the definition of flotation types which reflect differences in modal sulphide minerals and penalty minerals. This was then applied to the drilling database to assist with sample selection.
Based on the flotation test work results, a second and third iteration of performance model development was undertaken to improve the accuracy of the models.
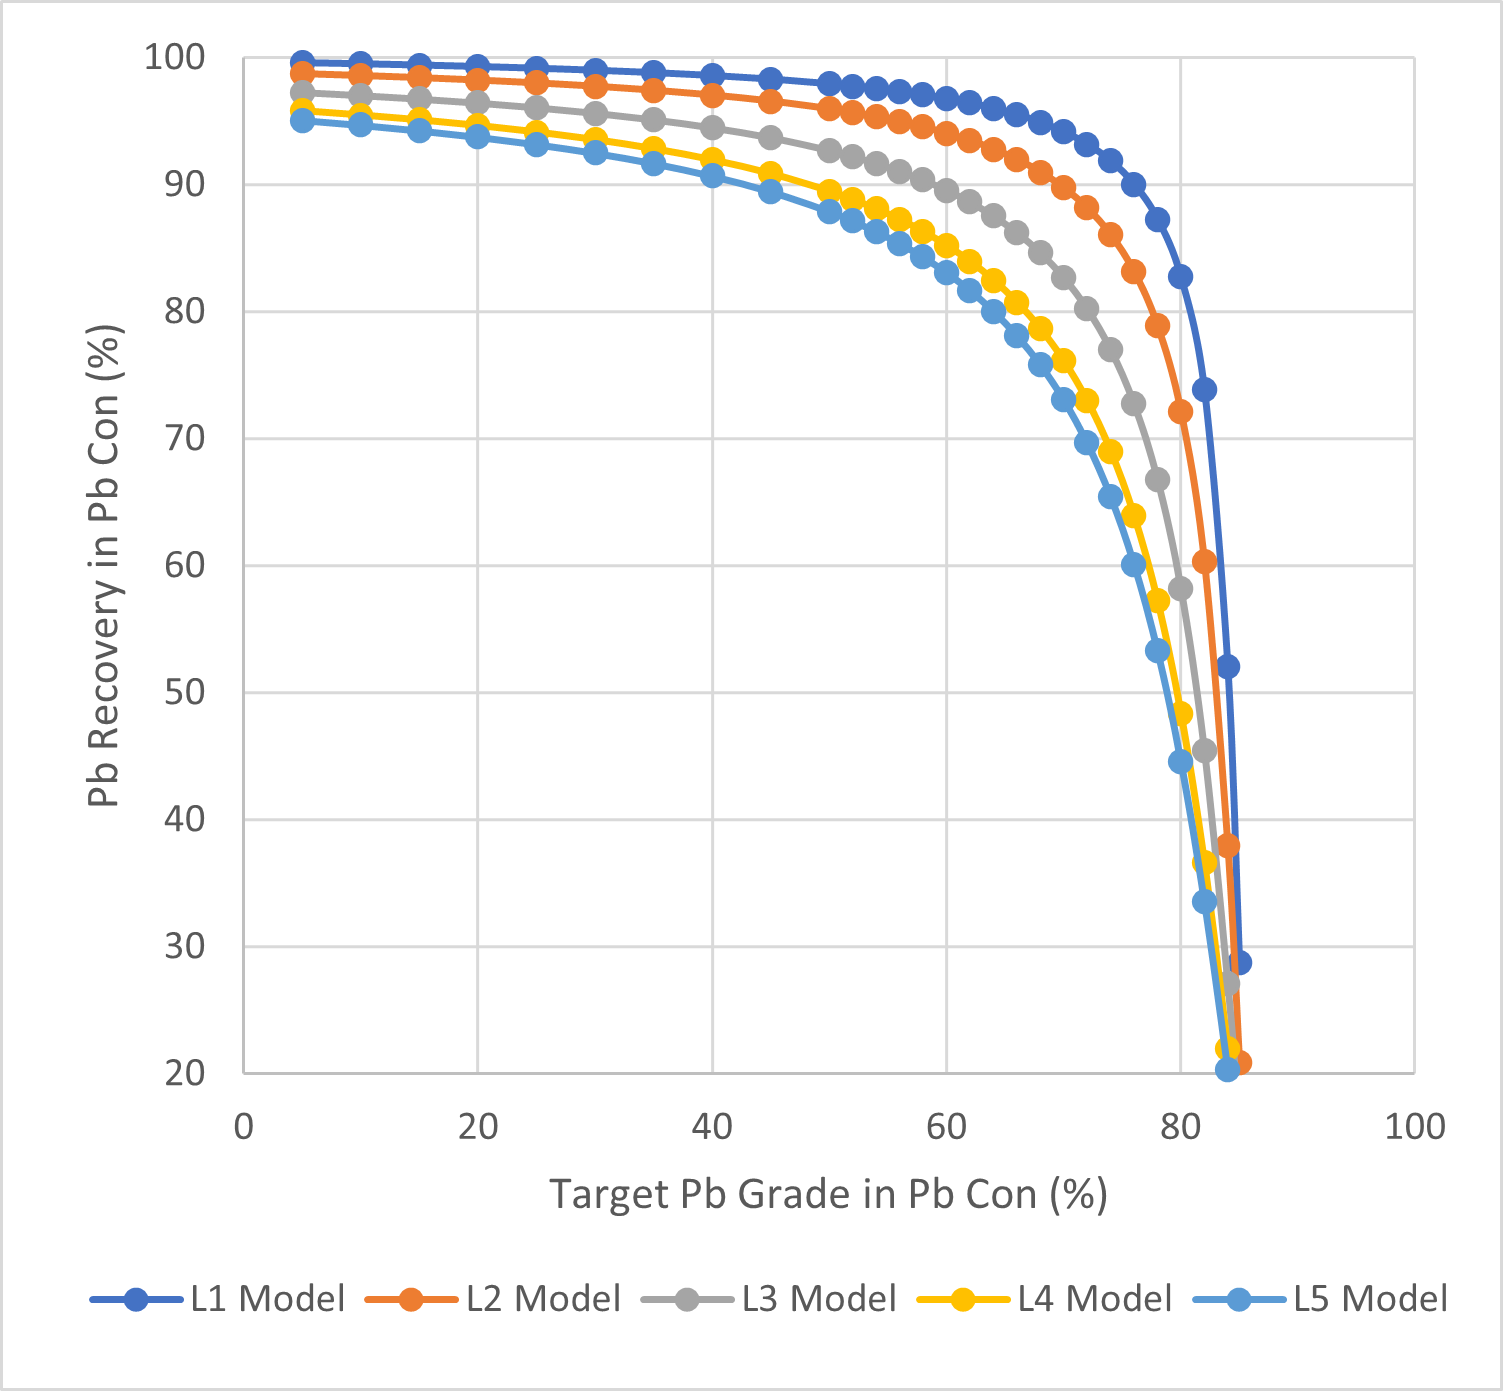
JKSimFloat was used in conjunction with JKTech Floatability Index test work and batch flotation test work to assist in the development of the following models:
- Pb in lead concentrate;
- Zn in lead concentrate;
- Ag in lead concentrate;
- Zn in zinc concentrate;
- Pb in zinc concentrate;
- Arsenic in both concentrates; and
- Fluorine in both concentrates.
Stage 3 - Validation of performance models against operating data
A number of stopes were batch processed through the processing plant in order to validate the models.
The objective of these stopes was to provide a good indication of the process performance for a 'single' source against which the models could be validated and calibrated if necessary.
The models were also retrospectively applied to monthly data from previous years production to provide another method of validation.
Results
The values of Axb and BBMWI as measured in the processing plant, were within the predicted range for all stopes. The model provided good guidance as to Axb and BBMWI to expect on a stope by stope basis – within 9 Axb units and 1.3 kWh/t for BBMWI.
The predicted mill throughput was within the accuracy required when compared to the actual mill throughput.
Zinc flotation performance was within the predicted performance range (+/- 0.5% recovery), but required one iteration of calibration and re-validation.
Lead and silver flotation performance was within the predicted performance range, within 2% and 3% recovery respectively for the same concentrate grade.